1.2.3. DATA TYPES
Most parameters can store two different kinds of data: Volatile and Persistent. Volatile data is inherited from one or more sources and is destroyed (i.e. recollected) whenever a new solution starts. Persistent data is data which has been specifically set by the user.
1.2.3.1. PERSISTENT DATA
Persistent data is accessed through the menu, and depending on the kind of parameter has a different manager. A Point parameter for example allows you to set one or more points through its menu. But, let’s back up a few steps and see how a Point Parameter behaves.
When you drag and drop a Point Parameter from the Params/Geometry Panel onto the canvas, the Parameter is orange, indicating it generated a warning. It’s nothing serious, the warning is simply there to inform you that the parameter is empty (it contains no persistent records and it failed to collect volatile data) and thus has no effect on the outcome of the solution. The context menu of the Parameter offers two ways of setting persistent data: single and multiple. Right click on the parameter to set Multiple Points. Once you click on either of these menu items, the Grasshopper window will disappear and you will be asked to pick a point in one of the Rhino viewports.
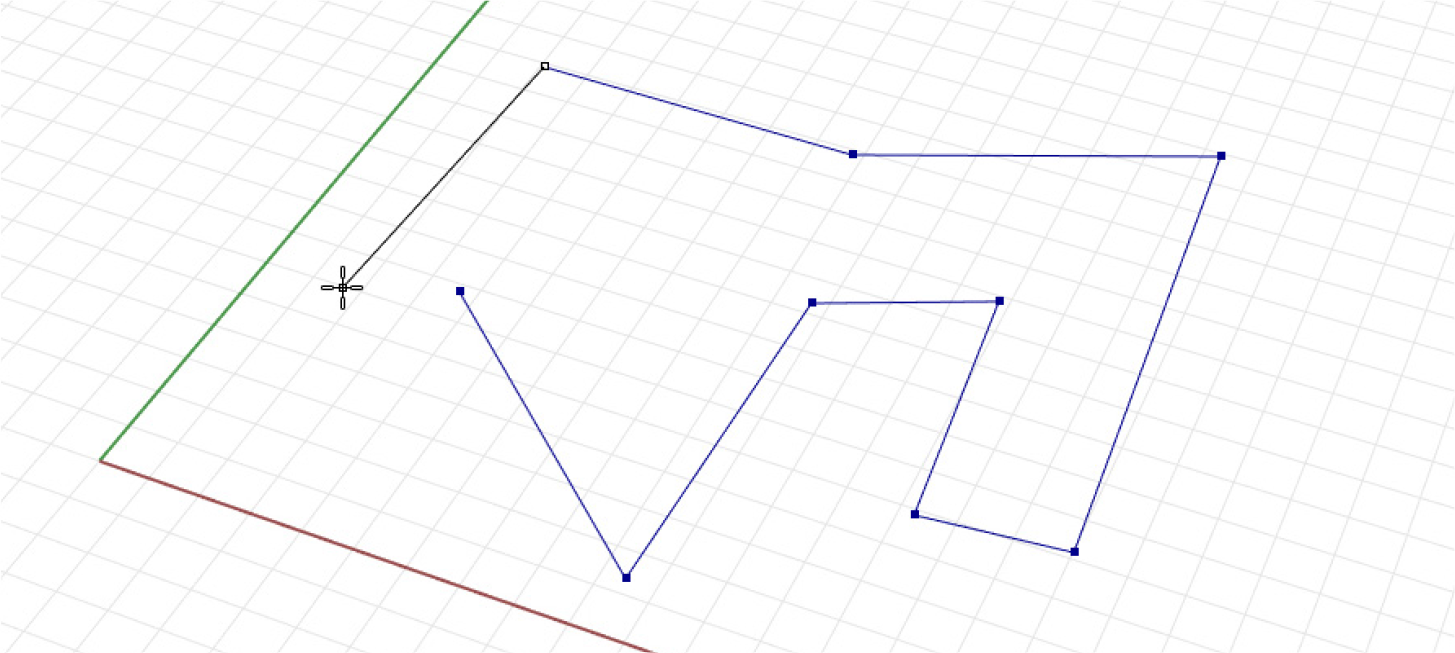
Once you have defined all the points you can press Enter and they will become part of the Parameters persistent data record. This means the Parameter is now no longer empty and it turns from orange to grey. (Notice that the information balloon in the upper right corner also disappears as there are no more warnings). At this point you can use the points stored in this Parameter for any subsequent input in your definition.
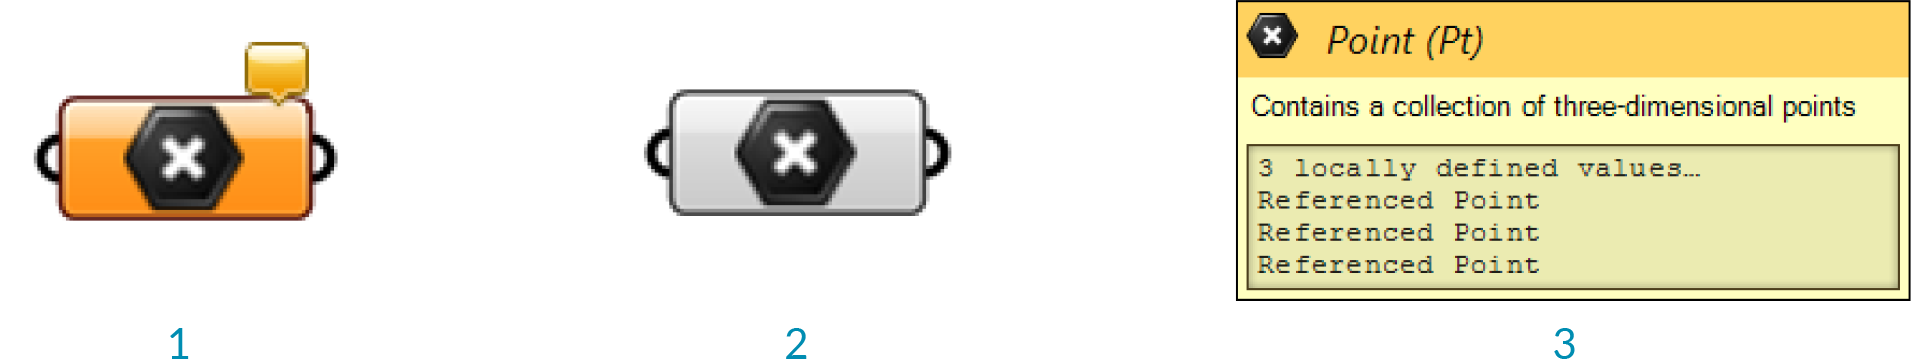
- The parameter is orange, indicating it contains no persistent records (and it failed to collect volatile data) and thus has no effect on the outcome of the solution. Right click on any parameter to set its persistent data.
- Once the parameter contains some persistent data, the component will turn from orange to grey.
- The tooltip for the point parameter shows the persistent data (a collection of referenced points) that is stored.
1.2.3.2. VOLATILE DATA
Volatile data, as the name suggests, is not permanent and will be destroyed each time the solution is expired. However, this will often trigger an event to rebuild the solution and update the scene. Generally speaking, most of the data generated ‘on the fly’ is considered volatile.
As previously stated, Grasshopper data is stored in Parameters (either in Volatile or Persistent form) and is used in various Components. When data is not stored in the permanent record set of a Parameter, it must be inherited from elsewhere. Every Parameter (except output parameters) defines where it gets its data from and most Parameters are not very particular. You can plug a number Parameter (which just means that it is a decimal number) into an integer source and it will take care of the conversion.
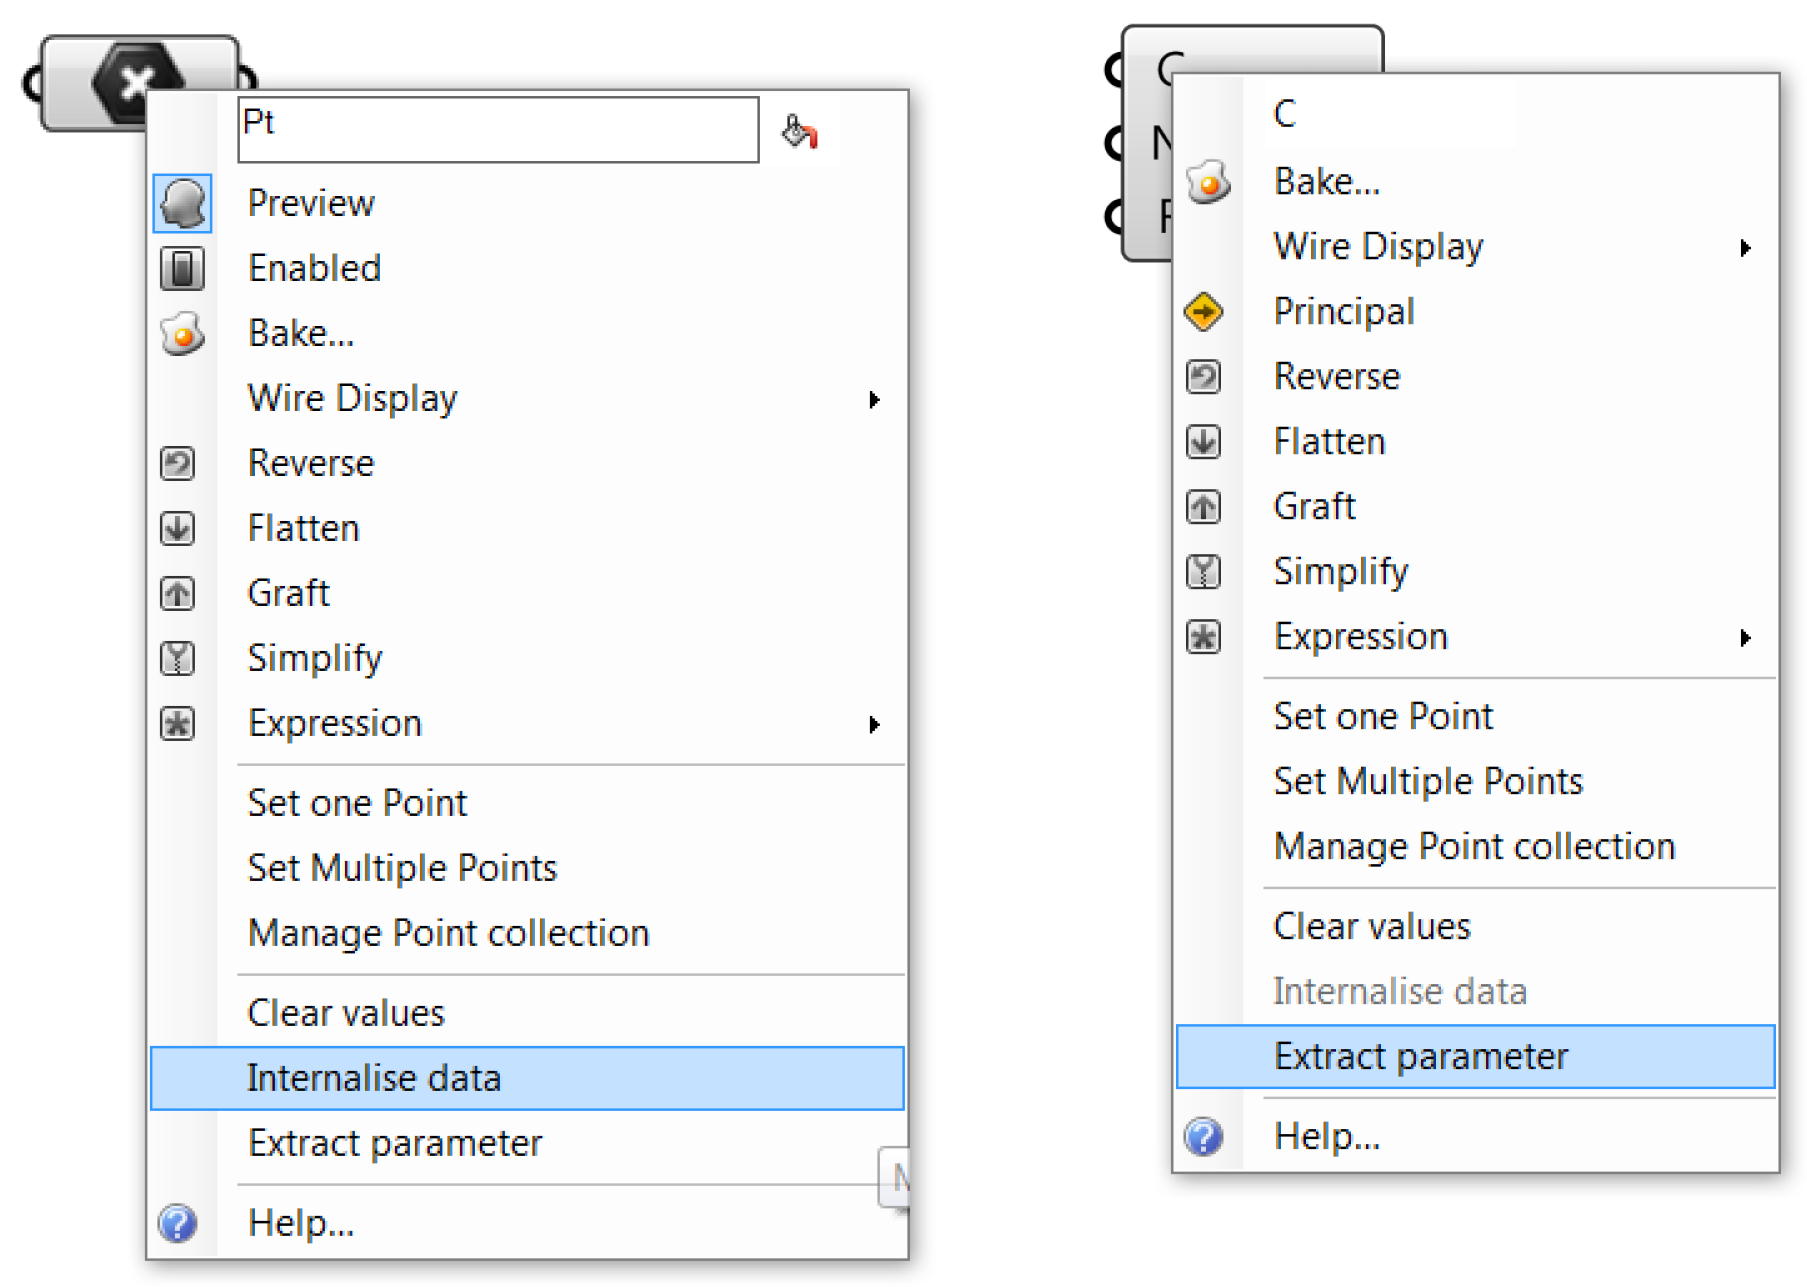
You can change the way data is inherited and stored in the context menu of a parameter or component input. To change store referenced Rhino geometry in the grasshopper definition itself, right click a parameter and select Internalise data from the menu. This is useful if you want your grasshopper definition to be independent from a Rhino file.
You can also Internalise data in a component input. Once you select Internalise data in the menu, any wires will disconnect from that input. The data has been changed from volatile to persistent, and will no longer update.
If you want the data to become volatile again, simply reconnect the wires to the input and the values will automatically be replaced. You can also right click the input and select Extract parameter. Grasshopper will create a parameter connected to the input with a wire that contains the data.
1.2.3.3. INPUT PARAMETERS
Grasshopper has a variety of Parameters that offer you the ability to interface with the data that is begin supplied to Component inputs and thereby control for changing the result of your definition. Because they Parameters that change with our input, they generate Volatile Data.
Number Slider The number slider is the most important and widely used Input Parameter. It allows us to output a value between two given extremes by interacting with its grip with our mouse. Sliders can be used to specify a value and see the change to our deifnition that comes with adjusting the grip, but a slider should also be thought of as the means to identify successful ranges of our definition.
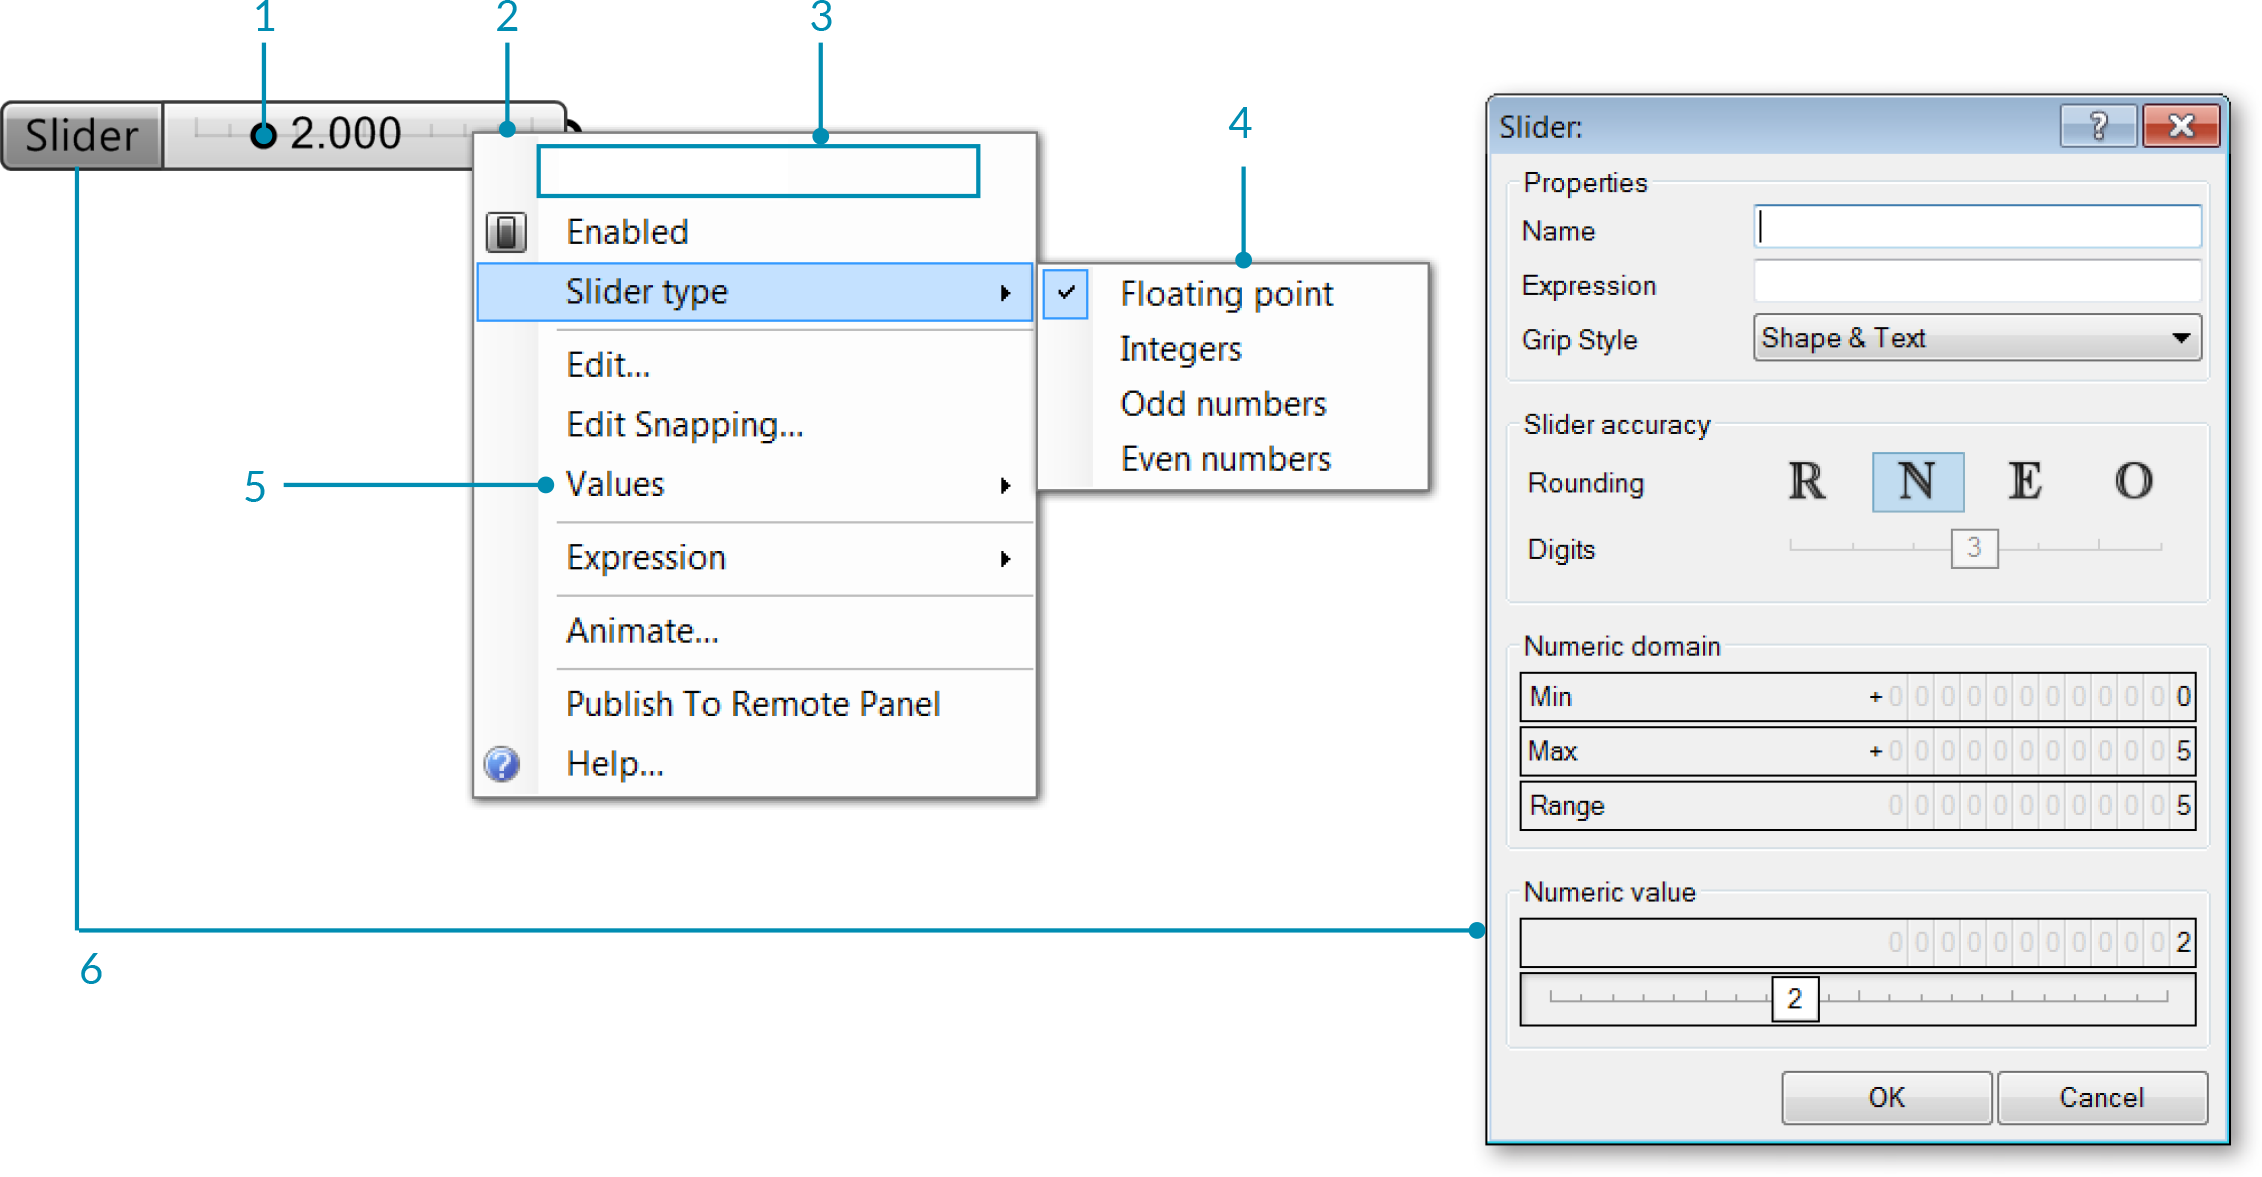
- Drag the slider grip to change the value - each time you do this, Grasshopper will recompute the solution.
- Right click the slider component to change the name, type, and values.
- Editable text field for the slider name.
- Select the type of number for the slider to use.
- Edite the range of values.
- Double click the name portion of the slider component to open the Slider Editor.
Graph mapper The Graph Mapper is a two-dimensional interface with which we can modify numerical values by plotting the input along the Graph’s X Axis and outputting the corresponding value along the Y Axis at the X value intersection of the Graph. It is extremely useful for modulating a set of values within an institutive, grip-based interface.
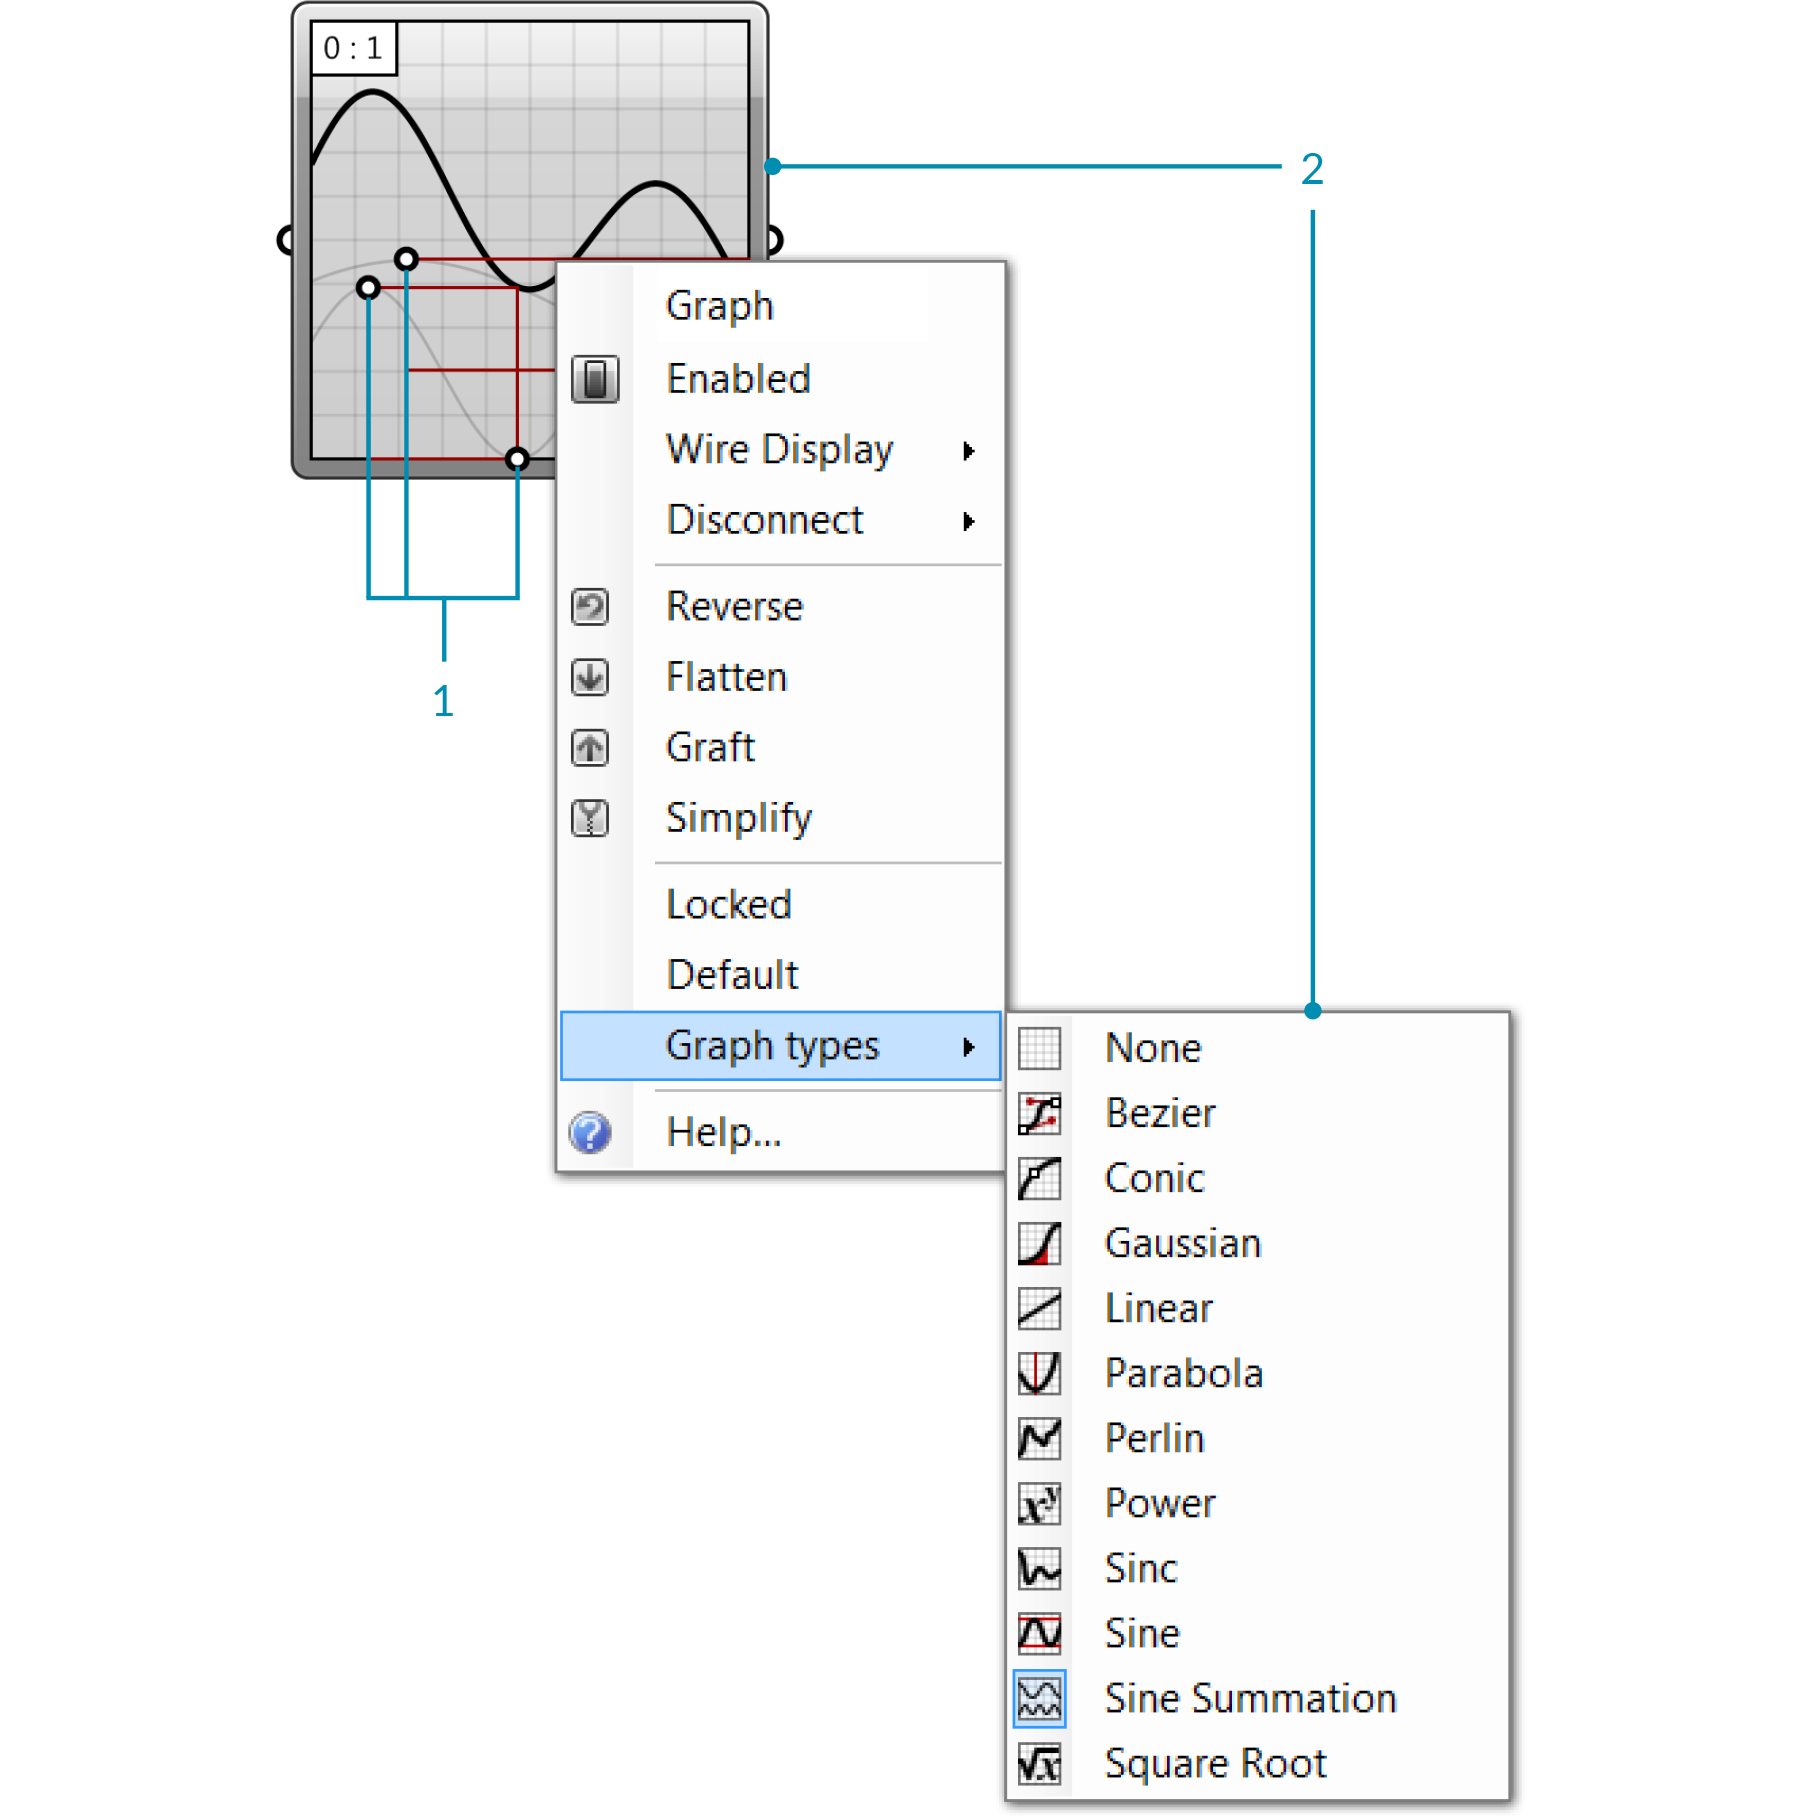
- Move the grips to edit the graph - each time you do this, Grasshopper will recompute the solution.
- Right click the graph mapper compenent to select the graph type.
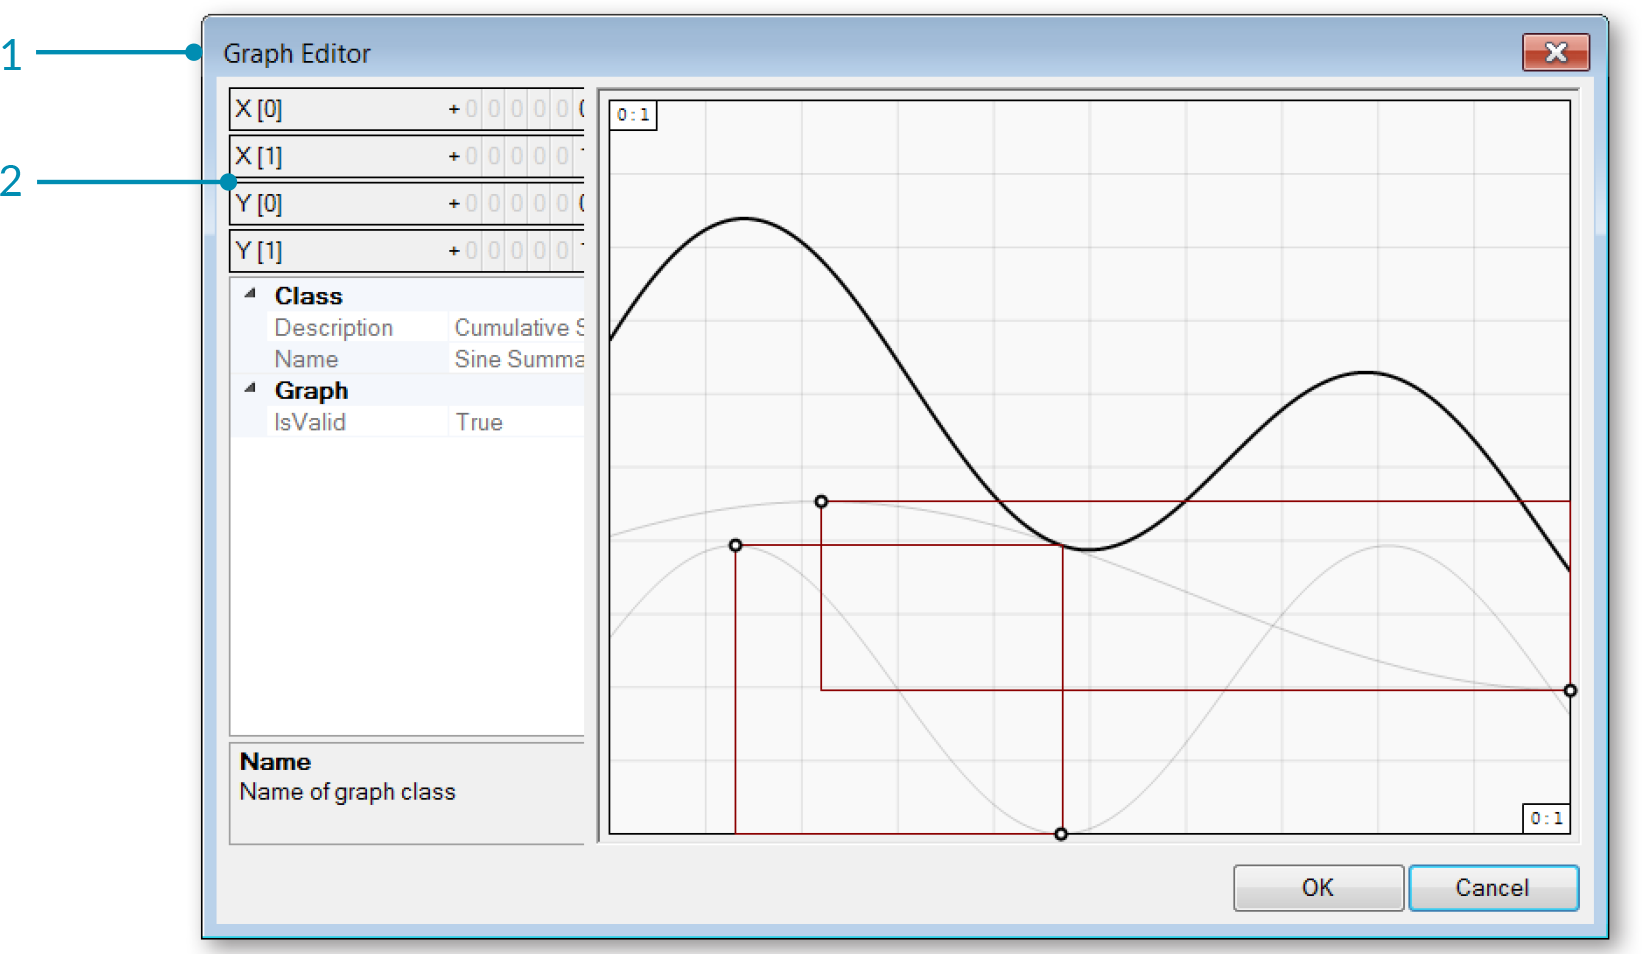
- Double click the graph mapper to open the Graph Editor.
- Change thex and y domains.
Value List The Value List stores a collection of values with corresponding list of Labels associated by way of an equal sign. It is particularly useful when you want to have a few options, labeled with meaning, that can supply specific output values.
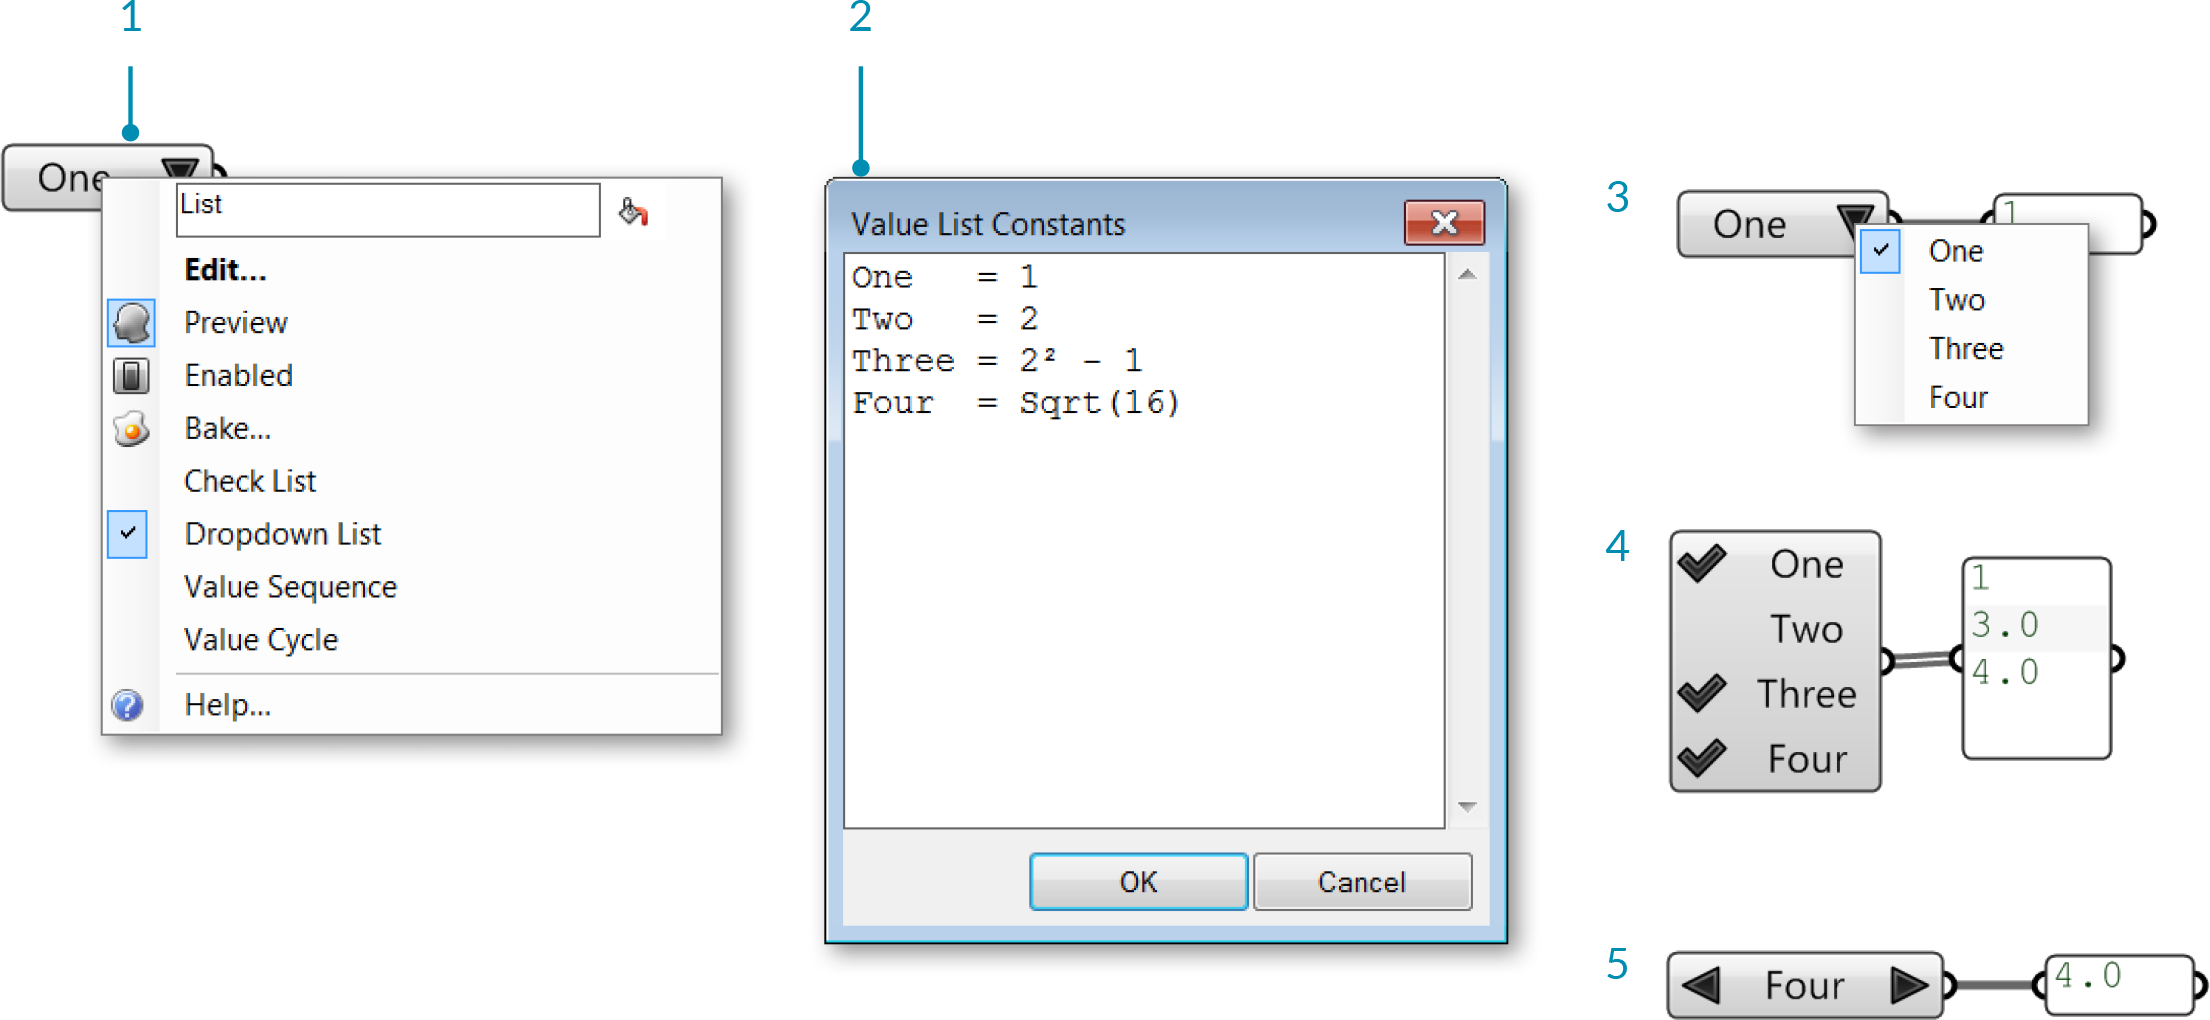
- Right click the Value List component and select an option from the menu.
- Double click the Value List component to open the editor and add or change values.
- In Dropdown List mode, click the arrow to select one of the values. The solution will recompute each time you change the value.
- In Check List mode, click next to each value to check it. The component will output all the values that are checked.
- In Value Sequence and Value Cycle modes, click the left and right facing arrows to cycle through the values.